Digitata Behavioural Banking turns core banking transaction data into behavioural understanding - five scored dimensions per customer, a living Customer 360, real-time churn detection and an agentic campaign loop that acts on the signal. No surveys. No declared preferences. Pure revealed behaviour.
Two customers with the same age, income and product holding can behave nothing alike. One saves on a fixed schedule and never checks a rate. The other holds a cash buffer, panics on a failed payment and leaves after one bad experience.
Demographic segmentation cannot tell them apart - so banks treat them identically and lose both. Behavioural Banking scores the difference from transaction data the institution already holds, and makes it usable by the people who run retention, pricing and product.
The same message, the same offer, the same tone to customers with opposite motivations.
Attrition is visible in monthly reporting only once the customer has already gone.
Blanket discounting buys volume from customers who would have stayed anyway.
The richest behavioural dataset in the institution sits inside the core, unexploited.
The Customer Behaviour Scoring engine is an XGBoost multi-output regressor trained across 16 engineered features. It scores five behavioural dimensions per customer, achieves R2 = 0.674 on core banking data, and produces an actionable profile within a 90-day transaction window.
Detected by: fixed-schedule flows, low spend variance, standing orders, high savings consistency.
What it means: highest loyalty potential. Responds to scheduled products, rate locks and tier upgrades. Very low churn risk unless service fails.
savings_cv - auto_transfer_ratio - savings_rate
Detected by: post-income bursts, end-of-month spikes, late-night activity, present bias.
What it means: responds to time-limited offers and urgency triggers. Volume is unpredictable - liquidity and limits must flex.
payday_decay_rate - night_spend_ratio - eom_spike_ratio
Detected by: large cash buffers, spending pullback after balance drops, insurance spend above actuarial value.
What it means: highest churn risk from any service failure. Needs guarantees, real-time status and visible service recovery.
balance_drop_response - emergency_buffer - insurance_excess
Detected by: provider switching, cross-account transfers, active rate comparison, financial sophistication.
What it means: hardest to retain on price. Value must come from speed, limits, preferred rates and exclusive access.
provider_switch_rate - cross_account_xfer_rate
Detected by: hedonic spend, subscription density, premium brand affinity, broad category entropy.
What it means: high ARPU potential. Responds to premium tiers, concierge service and relationship management.
experience_spend_ratio - subscription_density - brand_premium_index
Behavioural patterns emerge within 90 days of transaction history. A new customer can be classified and served on strategy before churn risk has a chance to solidify - and before a competitor's onboarding offer lands.
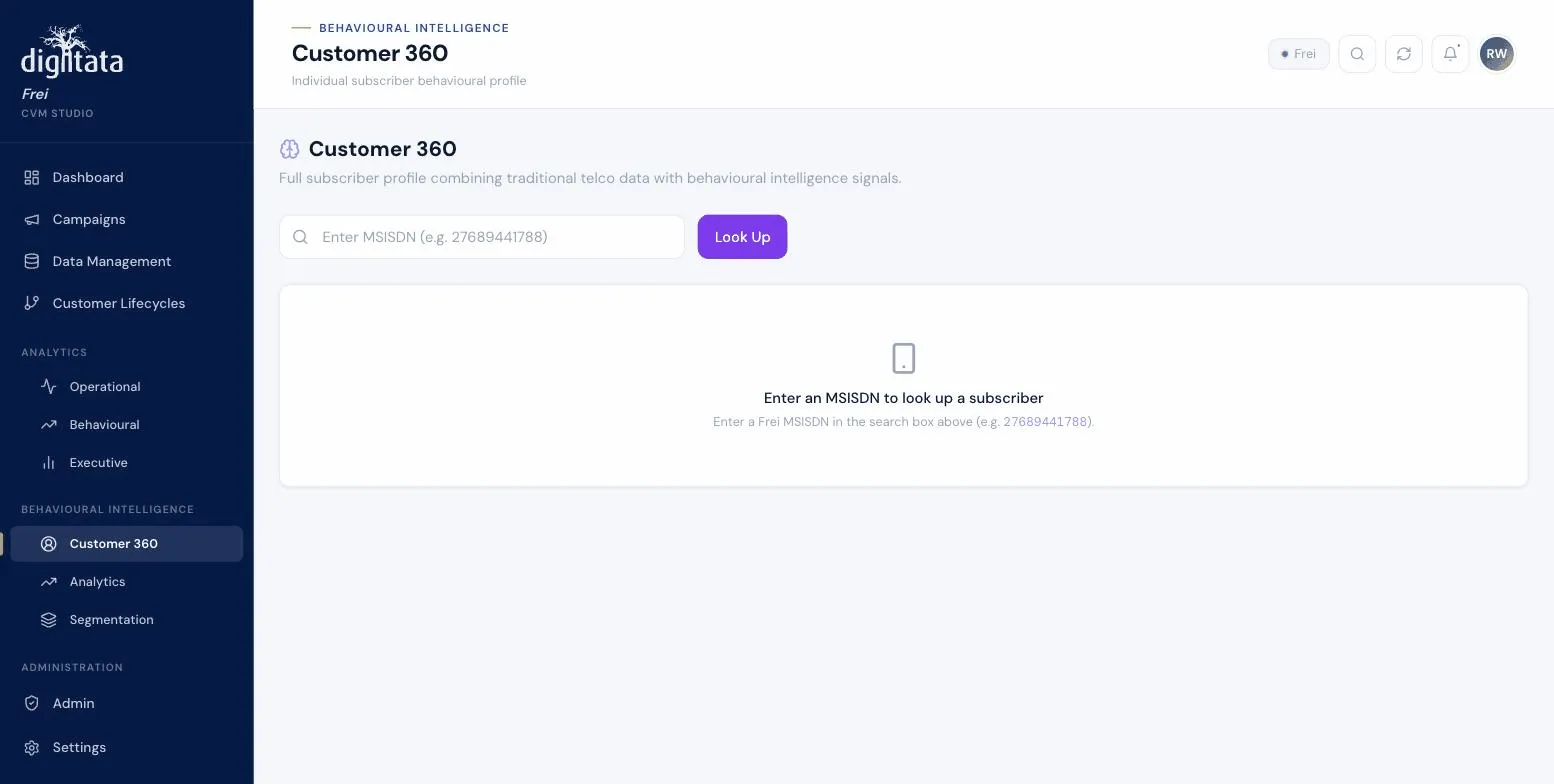
Every customer carries a profile that combines behavioural scores with lifecycle and engagement context, and updates continuously as new transactions arrive.


Scores tell you what a customer does. The psychographic layer tells you the disposition to speak to - the difference between an offer that reassures and one that pressures.
Each axis is scored from behaviour and feeds message tone, channel and offer construction - not just targeting.
The churn risk monitor tracks defection signals across every segment in real time, isolates the trigger event behind a risk surge, and quantifies the revenue in motion before it leaves.
Churn probability per segment with week-on-week movement, so you see which cohorts are shifting and how fast.
Competitor promotion, service degradation, rate movement, payment or payout failure - the cause behind the surge, named.
Where defection is concentrating - branch, region or market - for operational response.
Annual value in motion per segment, so intervention budget goes where the money is.
High, medium and low bands focus operations on the highest-value cohorts first.
Churn risk spikes automatically correlated against incidents in the previous 72 hours.
| Churn signal | What it indicates |
|---|---|
| Activity frequency decline | Weekly to fortnightly to monthly - the classic pre-churn trajectory |
| Rate enquiry without conversion | The customer is checking and comparing with a competitor |
| Relationship shift | Balances or flows moving to a secondary institution without an obvious reason |
| Support contact spike | Query or complaint volume rising on a product line, ahead of segment-level churn |
| Failure correlation | Risk rising sharply among customers who experienced a failed payment or outage |
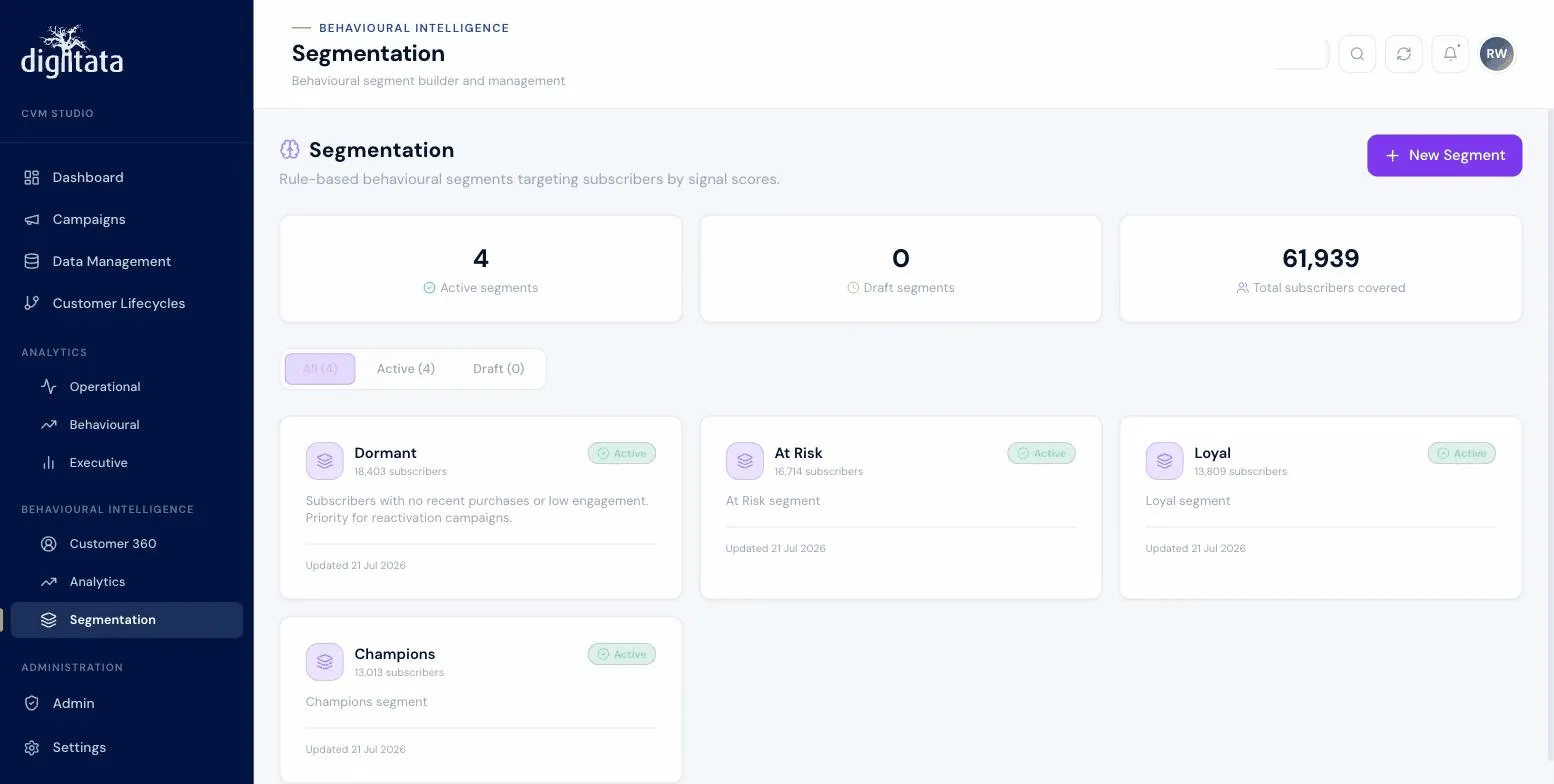
Retention and CX teams build cohorts themselves, combining static attributes, calculated behavioural metrics and ML scores, with live size and revenue-at-risk preview before anything launches.


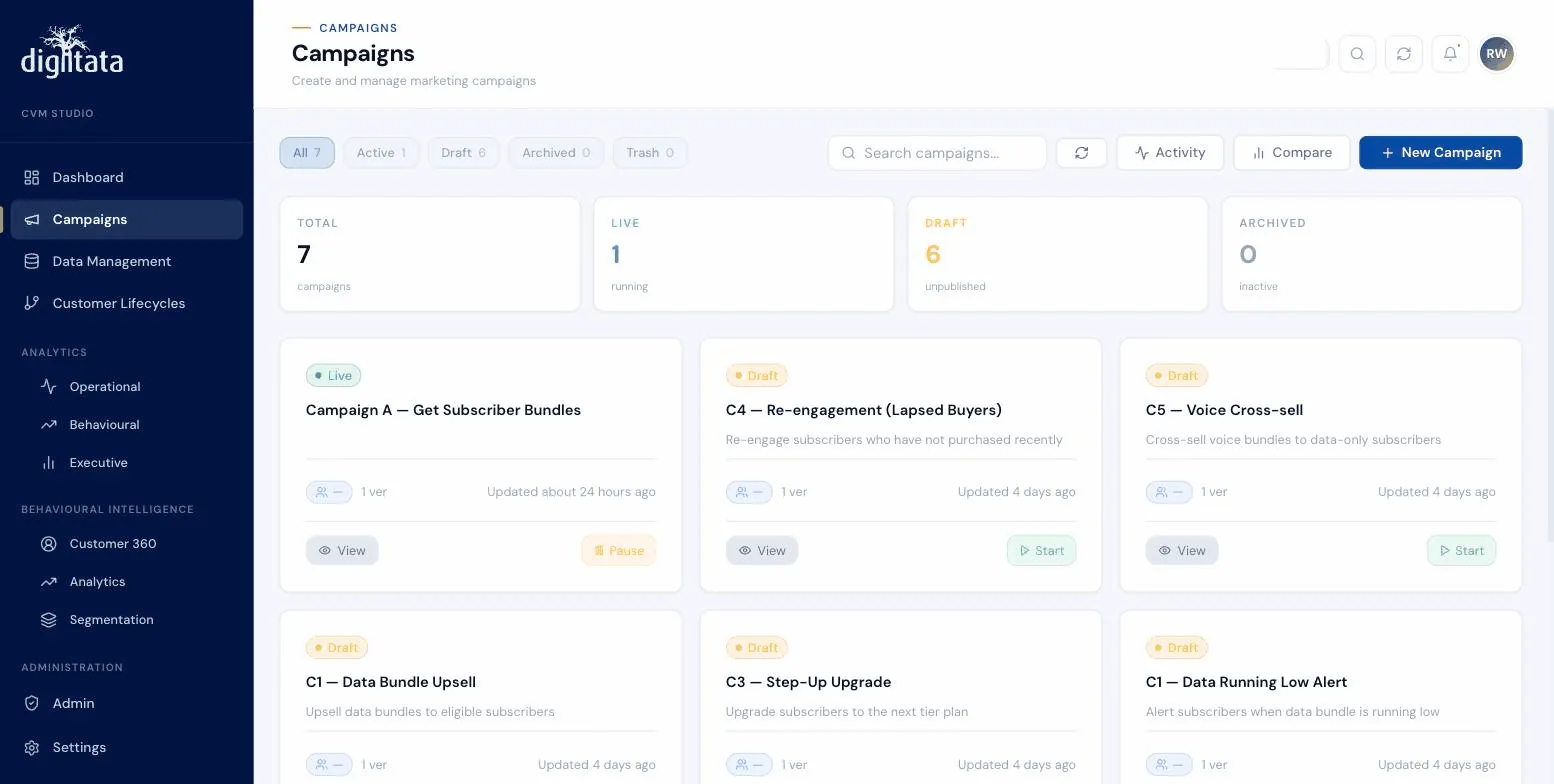
Identifying risk is half a loop. The campaign engine closes it - personalised outreach generated from the behavioural profile, delivered on the channel the customer actually uses.
The agentic layer runs the full retention workflow continuously - scanning for emerging risk, generating a personalised intervention per customer, and submitting it for delivery, with an optional human gate before anything reaches a customer.
Not a monthly batch. Risk is identified within hours of a behavioural shift, across the entire base.
Offer, channel, tone and timing are constructed against that customer's CBS profile and psychographic axes.
Operations review and approve AI-recommended campaigns before launch - or set thresholds below which the loop runs unattended.
App push, SMS, WhatsApp, email, USSD and in-branch prompts - whichever the customer's engagement profile favours.
Delivery, redemption, churn reduction and revenue preserved measured per campaign and fed back into the models.
| Stage | What it looks like | How Behavioural Banking acts |
|---|---|---|
| New - days 1-90 | First transactions. Trust being built. Single product. | Onboarding series, reliability messaging. CBS profile forms and becomes actionable inside the quarter. |
| Active - months 3-12 | Regular activity. Habits forming. Behaviour readable. | Habit reinforcement, rate programmes, loyalty. Segment assigned and strategy applied. |
| Anchor - 12 months+ | Multi-product, high lifetime value, deepening relationship. | Premium tier, cross-product expansion, referral and relationship management. |
| At risk - signal detected | Frequency declining, comparison behaviour, support contact. | Immediate personalised intervention; service recovery where a failure triggered it. |
| Recovered | Reactivated and re-engaged. | Returned to the Active or Anchor track, with campaign ROI captured. |
Reads transaction, account and product data from existing core banking systems, data warehouses or an open banking feed.
Where core integration is slow, a consented open banking feed produces behavioural scoring on a live customer base as a low-friction first step.
The platform is productised and in production, not a bespoke build. Pilots run on real data inside a defined window.
Built for GDPR, DORA and EU AI Act obligations: explainable scoring, data residency, retention controls and auditable decisioning.
Every score decomposes into the features that produced it - defensible to a risk committee and to a regulator.
A staged commercial model: paid pilot on real data, phased implementation, then platform standardisation across the base.
The value sits in the gap between a first-year customer and an anchor relationship - and in the cost of the intervention that converts one into the other.
"Personalised outreach is the most effective retention lever measured on the platform - 83% effectiveness, against 42% for generic educational content."
Intervention effectiveness by type: personalised outreach 83% - loyalty rewards 75% - discount offers 62% - tier upgrades 58% - generic content 42%. The 41-point gap is the value of knowing who the customer is before you speak to them.
A pilot scores a live segment of your base and shows you the behavioural picture inside your existing transaction data - including who is about to leave, and what would keep them.